The science of why parts fail is complex and multi-disciplinary. Many elements need to be investigated, but part geometry is certainly one important part of the puzzle.
In this study, we will examine a heavily damaged wheel bearing component, and explore how 3d surface scanning can play a role in understanding part failure.
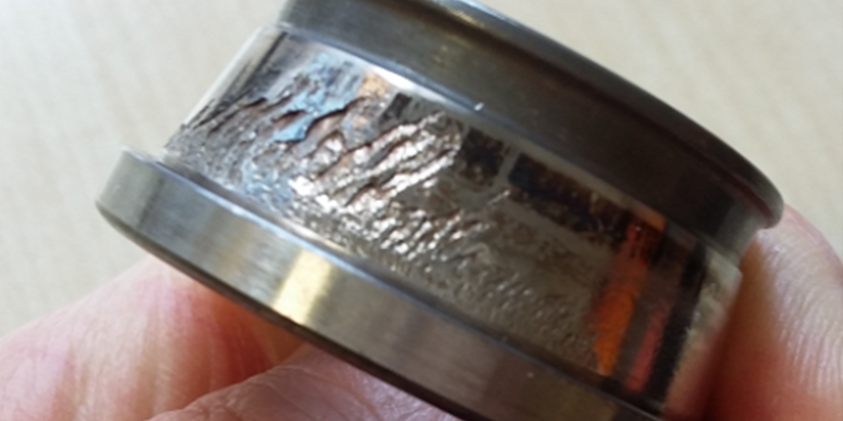
The part we will use for this case study is an inner bearing ring with a tapered (conical form) race surface. This part was retrieved from an automotive application, and is heavily worn from use. It has particularly heavy surface damage on one side, which is apparent by visual inspection.
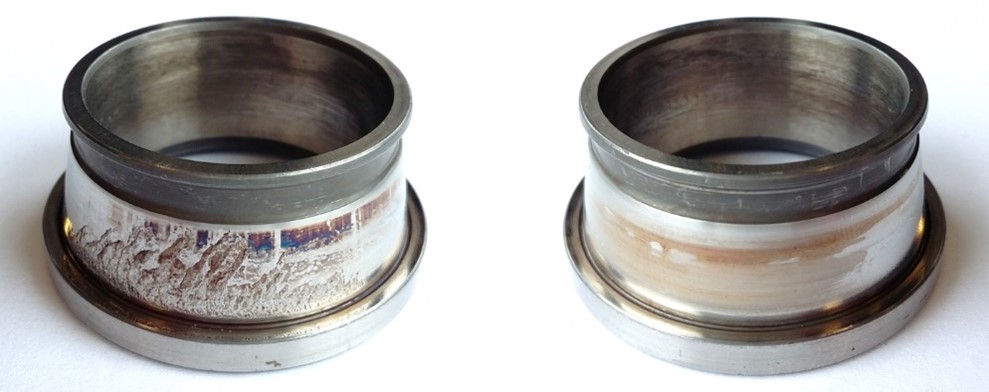
Front and rear view of worn wheel bearing with the region of heaviest wear shown on the left.
Often, the most heavily damaged parts are the most interesting. But for various reasons they are also commonly the most difficult to obtain high-quality measurement results from. Good fixturing, an appropriate selection of measurement equipment, a good scanning strategy and a suitable analysis & reporting pipeline are all important to success.
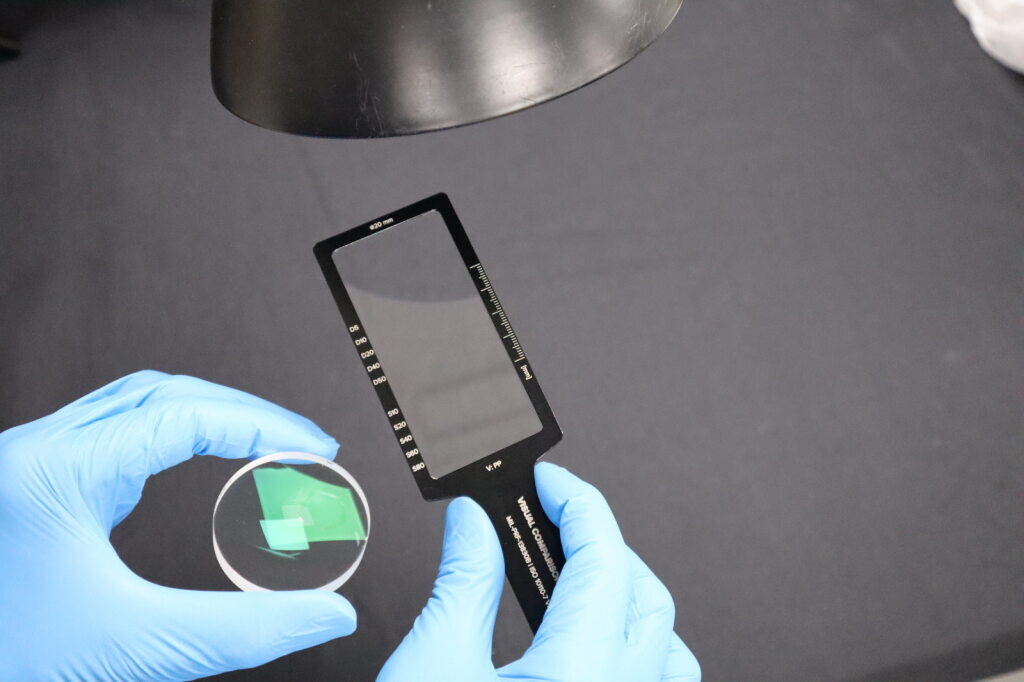
This measurement uses an OmniLux optical CMM. Although these CMMs can be configured to measure all faces on such a part, inside and out, in this case we will just focus on that heavily worn, conical taper bearing surface.
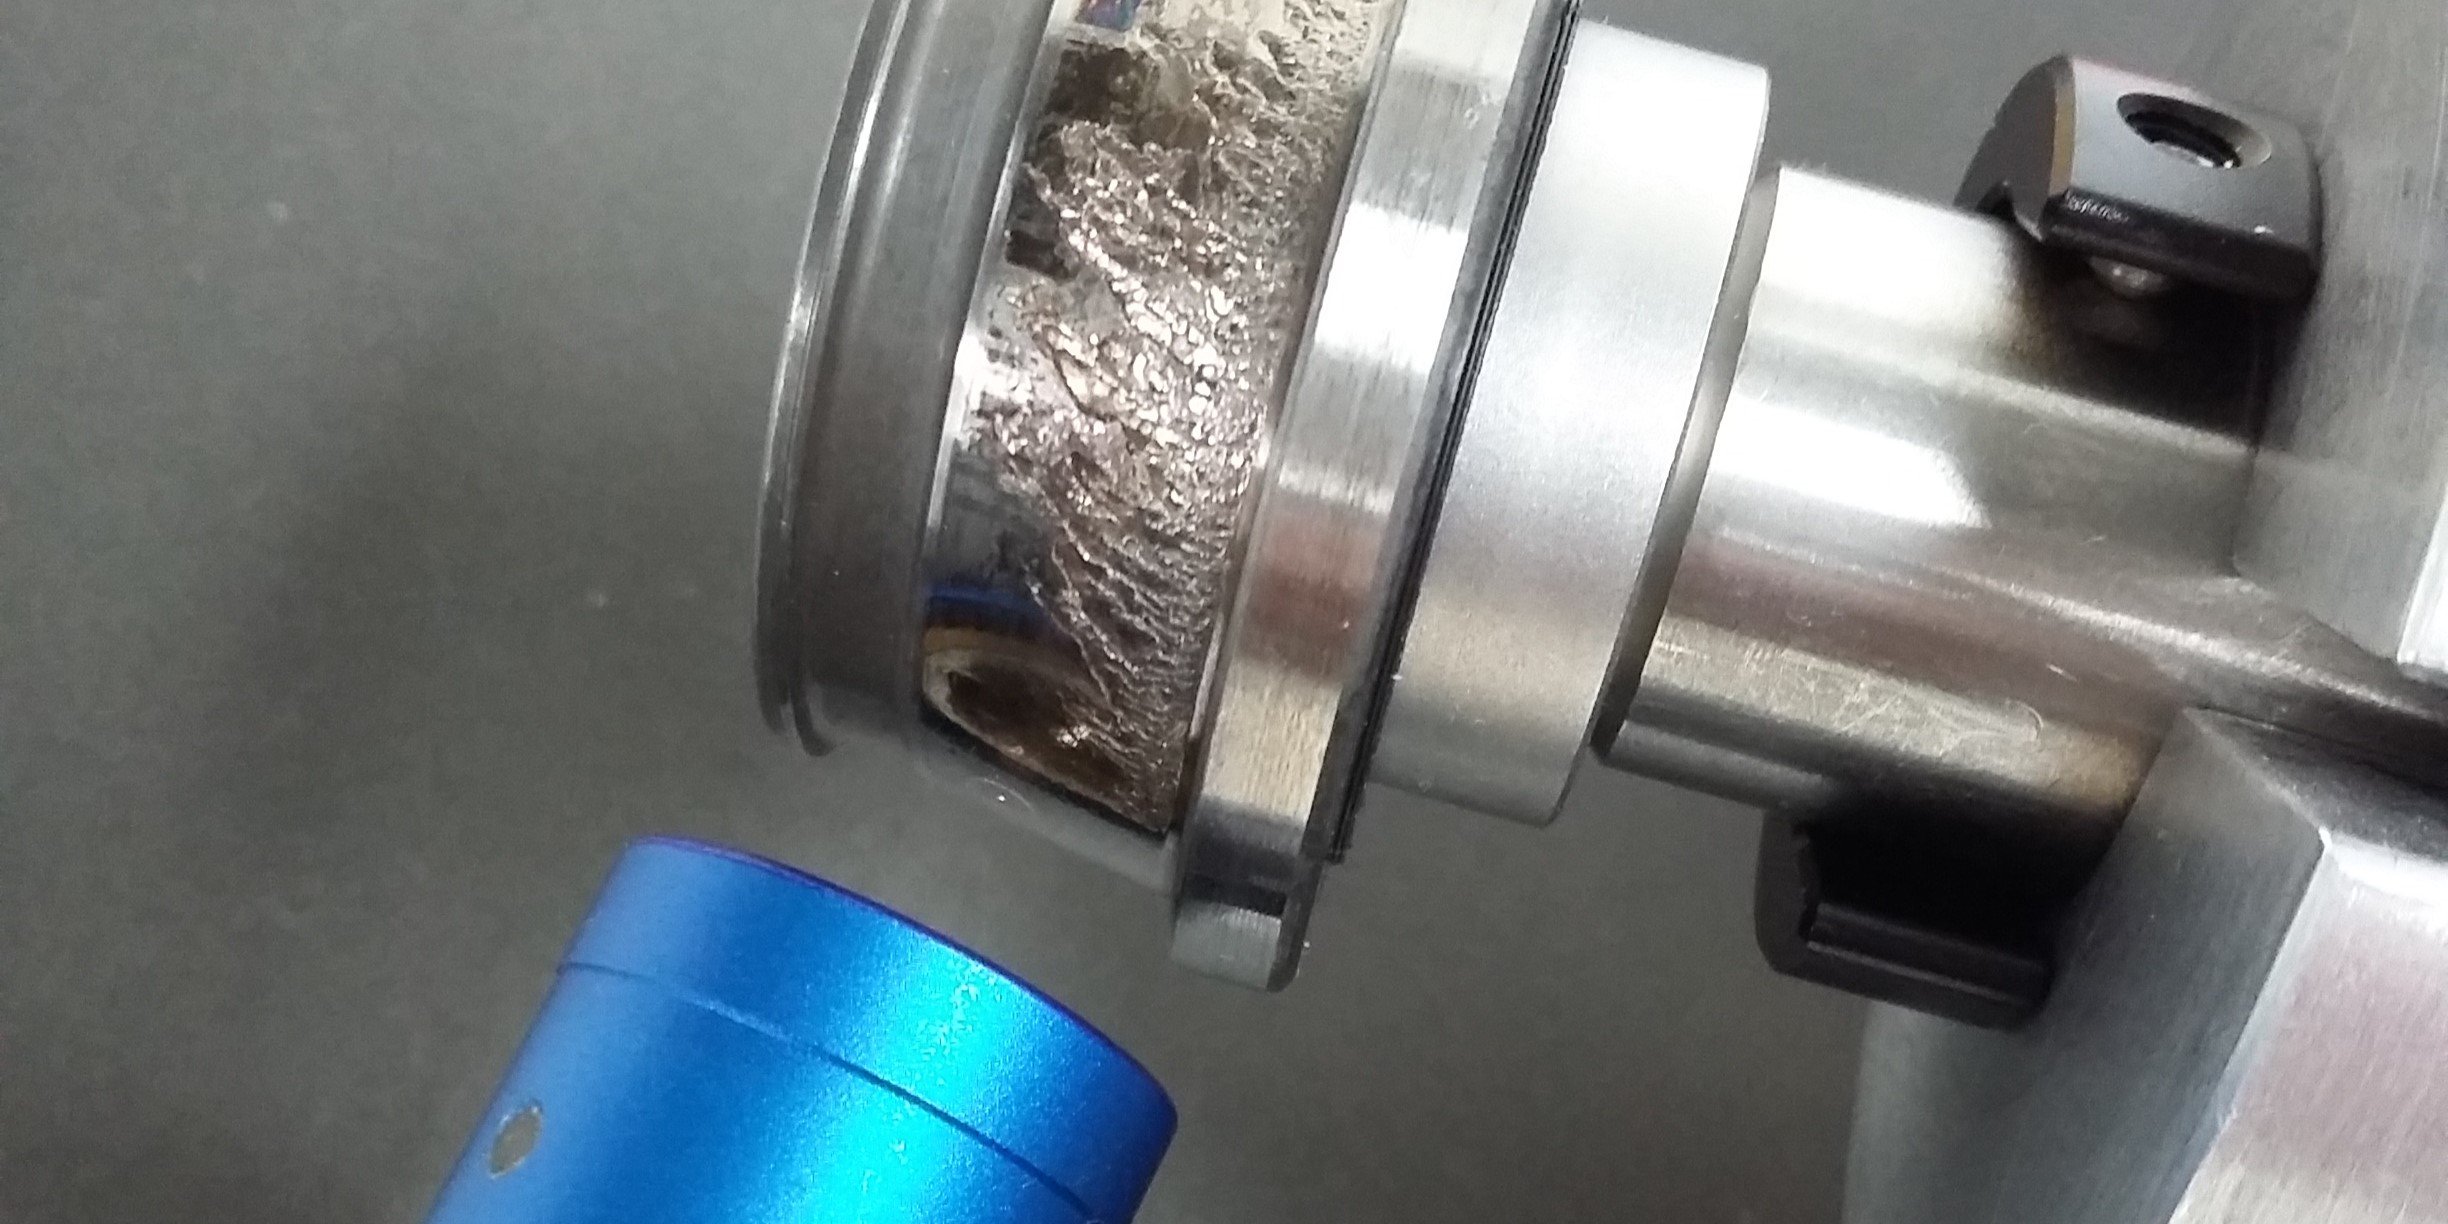 The worn bearing inside the optical CMM. The blue sensor head and the light spot on the surface can both be seen in this image.
The sensor choice for a worn part is one of the most challenging considerations. Area-effect sensors (e.g. hall or capacitive) might average out much of the surface variation; contact touch probes may damage or be damaged by the surface, especially where there are sudden pits or protrusions, and will again introduce probe averaging due to the touch probe radius. Even optical probes will struggle with very steep-sided fissures, and some data loss is likely if hardly any light reflects back into the sensor.
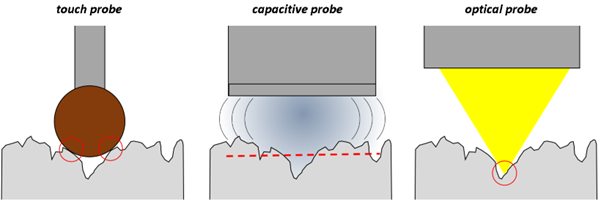
Different probe technologies. Contact touch probes cannot enter the deepest recesses (and may damage the surface or be damaged by the surface). Area-probes like hall or capacitive sensors average the surface, which is helpful in some applications, but not in detailed wear-map studies. Optical sensors can access surface recesses, but may lose data on very jagged edges.
No technology is perfect, although optical probes are generally the best choice for most wear studies, because they allow highly detailed measurements in a short space of time. If in doubt, consider performing a trial with different sensor technologies – or at least, get expert advice on the best sensor choice.
For many basic quality-check scans, simple 2D measures such as roundness, straightness, or profile-of-a-line are used and sufficient. However, when the goal is to assess surface damage, there is really no substitute for a full surface scan. Some analysis methods, such as volumetric wear estimation, can only be performed with a full surface scan.
This still leaves open the question of data point density (i.e. scan resolution); more detail in a data set can often reveal important information that might get lost with a lower resolution scan.
Practically, there is no point scanning finer than the lateral resolution of the sensor; e.g. with a sensor with an effective spot size of 50 µm, there is no point scanning every 1 µm, since the sensor acts as a low-pass averaging filter, so such fine details will be ‘blurred’ and the high resolution will just make the scan take longer to perform (and the results files larger and harder to work with) for no benefit.
In this case our sensor has a spot size of about 4 µm. We have collected data roughly every 10 x 10 µm, giving just under 7 million data points.
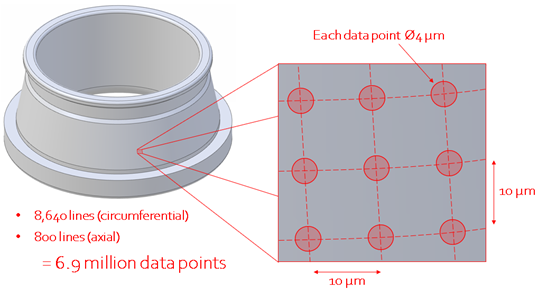 Chosen point density for the measurement of this wheel bearing with the optical CMM.
Note that even using a high resolution like this means our true surface-area coverage is still only about 12.5%. In other words, 88.5% (seven-eighths) of the surface is not directly measured. This is a challenge with any wear scan; a large amount of data is required to really understand the surface form. For this reason, such detailed wear scans are normally reserved for R&D operations, not in-line production. A scan at this resolution may require tens of minutes of scan-time, whereas a typical production-line quality scan of a bearing will take only seconds.
Just as important as collecting the data is how to analyse it afterwards. At a minimum, a single numerical value for an estimated change in volume based on the surface scan could be reported. For details on how that number is derived, see this piece). In that case, our entire report on this part might simply be:
Surface material loss: 9.7 mm³
And with some methods (e.g. gravimetric checks) all you can obtain is a single number like that. But reporting just a single number in this case fails to make the most of the rich dataset that has been collected during scanning. The full 3d height-map allows a user to see where material has been removed, and to what depth. In some cases it may also reveal where material has been deposited back on the surface and there is now, locally, more material than was the case initially.
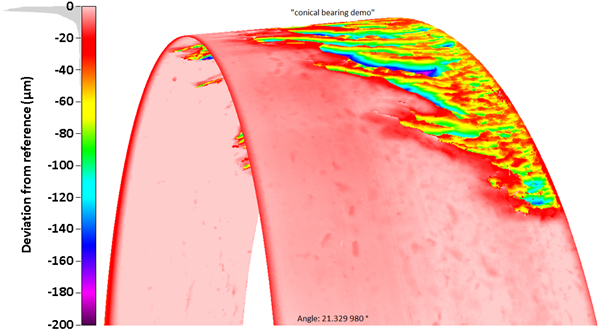
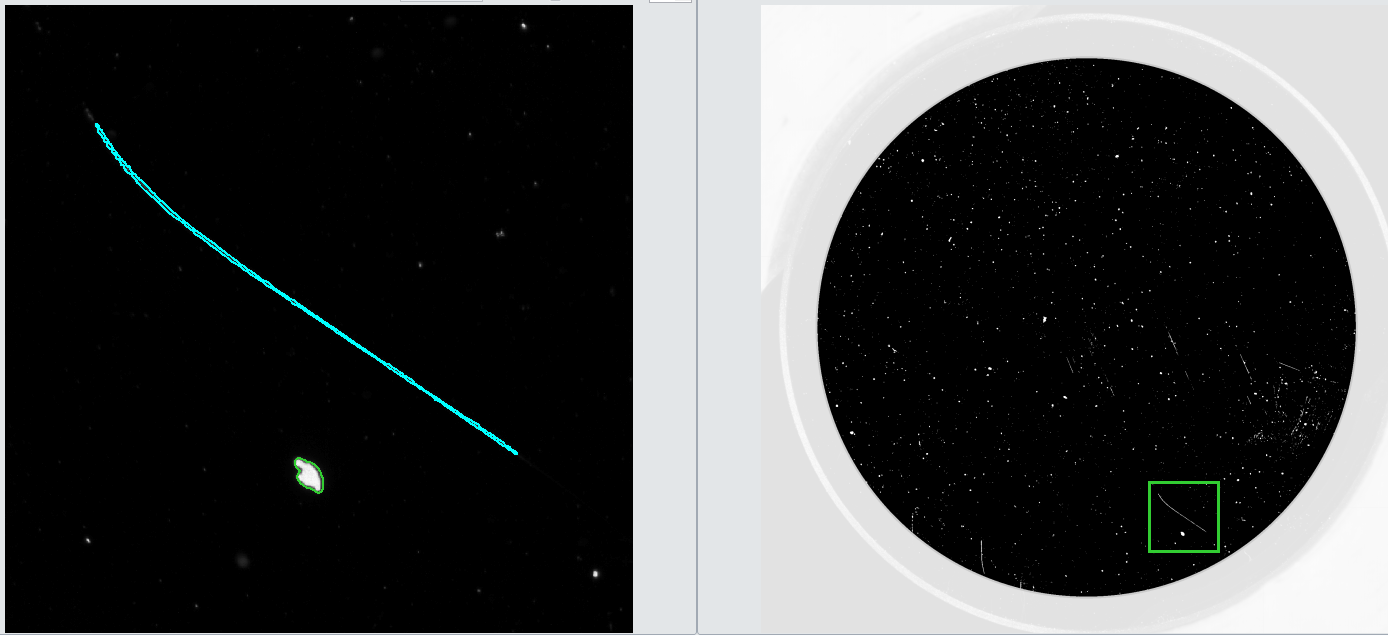
'Heat map' of the full surface, covering the highest peaks and lowest valleys from 0 to -200 µm.
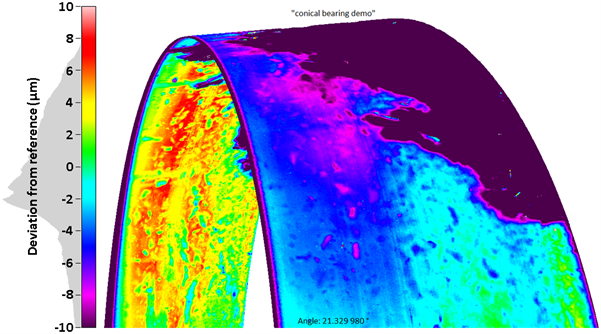
'Heat map' with a reduced depth, covering the surface that remains largely intact, albeit showing signs of embedded particles from 0 to -10 µm.
An attraction of an optical sensor is that the light-intensity (returned signal strength) in itself can contain additional information about the surface, almost like a high-resolution photo; this is included as a greyscale scan profile below.
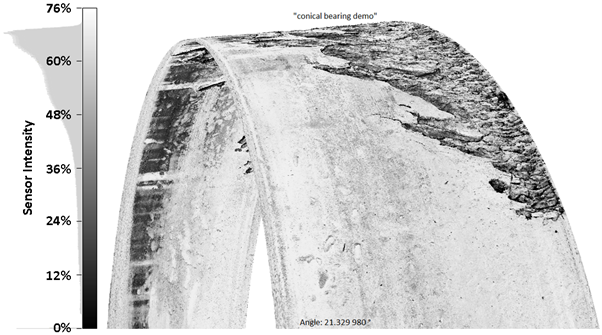 Reflected light intensity showing surface discolouration that is not visible in the height maps above.
For some more visualisations of wear scanning in action, see our blog posts on wear in orthopaedics and a more detailed academic study validating the methodology here.
Clearly, there is a vast wealth of data to pick over here; if the only option is printed, static reports (either hard copy print, or still image files or PDF reports) then always make sure the images included best represent the dataset. But in our experience, the best use of the data is to keep it in the 3D software environment, so that investigators can manipulate the part, zoom in on the surface, change the colour scales and truly ‘explore’ the dataset in full, immersive 3D. This is possible within the RedLux software tools, so long as the original raw data scans are saved.
Here we’ve looked very briefly at strategies for using CMM data to visualise complex wear effects on parts. We’ve seen that optical CMMs collecting very fine-resolution datasets give the best option for detailed, immersive 3D maps of surface form. But we have also seen that whatever equipment is used, care must be taken when deciding on sensor choice, scan resolution and how to visualise and represent data.
Of course, 3D surface scanning is not just helpful for R&D cases where component failures are studied. It is also incredibly useful for shop-floor inspection of good-quality components, to ensure they are within tolerance and to track production line performance. For more on how optical CMMs like those offered RedLux can help with quality inspection, see our series of articles on GD&T inspection, or read about our range of optical CMMs.