R. B. Cook1, C. Maul2, A. M. Strickland2
A version of this paper has been published in the ASTM Standard Guide for the Measurement of Tapers in Artificial Joints.
Accurate and validated volumetric values of loss are important for contextualisation of the importance of taper damage and if the factors affecting taper performance are to be studied. This study validates the volumetric loss values from the RedLux optical coordinate measuring machine, the sensitivity of the technique to the point cloud density and the repeatability of the technique. The limits of agreement (95%) between the optical CMM and the gravimetric values are -0.0416 mm3 and 0.173 mm3. The average measured angle was assessed against a calibrated taper and shown to be within 0.0024°.
Keywords: Taper, Validation, CoCr, Volumetric
Since the introduction of modular heads for total hip replacement (THR) surgery, there have been some concerns over the potential for fretting and corrosion of these devices. The latest National Joint Registry of England, Wales and Northern Ireland reported 10 year revision rates of 13 % for MoM resurfacings, compared to 19.7%, 21.9% and 18.25% for cemented, uncemented and hybrid MOM THRs respectively. This disparity in failure rates between Resurfacings and THRs was also noted by Langton et al. in a manufacturer and joint matched cohort where the failure rates for ASR hip resurfacings (DePuy, Leeds, United Kingdom) was 25% at 6 years, compared to 48.8% for the ASR THR (DePuy, Leeds, United Kingdom). The heightened wear rates at the articulating surface, observed in most of the failed hip resurfacing devices was not always observed in the LHMOMTHR failures, but damage was seen at the stem/head taper interface. Taper damage on retrieved hip replacements has been reported extensively in the literature and linked to adverse local tissue reactions (ALTR) in both MoM [1-3] and metal-on-polymer (MoP) [2, 4-6] joints. The aetiology and long term consequences of these failures and subsequent complex revision surgery remains unknown and there are growing concerns about the systemic effects of exposure to elevated chrome and cobalt levels.
As a result of these heightened failure rates, the design, geometry, surface finish and material combinations of the mating components forming the taper interfaces has come under scrutiny.
Retrieval studies consistently report that taper damage was more pronounced in the mixed metal alloy cohorts [7-13]. This can be attributed to potential differences between the metals providing a galvanic driving force, but also a mechanical mismatch. The difference in the modulus of the alloys results in different levels of elastic deformation under the same loading, resulting in relative motion between the surfaces [14].
Various taper designs are used, and these are often referred to in terms of their nominal small and large diameter (e.g. 11/13, 12/14). The difference in angle between the male and female tapers is generally within 1 arc-minute (0.017°)[15], but different implant manufacturers have designed the head and stem taper to lock differently. Variation in the taper angle clearance, defined as: taper angle of head - taper angle of stem , enables the two mating parts to either contact at the taper throat (proximal end), as is required by ceramic ball manufacturers, or at the taper mouth (distal end). Proximal contacting tapers have been implicated as an issue for metal-metal taper contacts, although a cohort study found no significant difference between proximally and distally contacting tapers, when a 4 point visual scoring method is used. However, this visualisation method is poorly correlated to actual volumetric loss and these findings should be treated with caution.
The taper designs have also changed in size over the last decade. The stem taper lengths were historically around 16 mm and would extend out of the head taper. The majority of tapers are now much shorter (10 or 12 mm long) and sit inside the head taper[16]. The paper by Panagiotidou et al. (2013)[17] found that the shorter length stem tapers were associated with higher levels of fretting corrosion, during in-vitro simulations. However, this contrasts with the retrieval findings of Nassif et al. (2014)[18] who found that smaller diameter stem tapers with short engagement lengths such as the type 1 taper, had reduced fretting corrosion damage in retrievals.
The surface finish is important and stem tapers with more pronounced roughness are being linked to an increase in the level of measured damage in-vitro[17].
For large diameter metal modular heads, taper surfaces on retrieved devices have been investigated using coordinate measuring machines (CMM)[16, 19], or roundness instruments[20, 21]. While both systems can detect relatively high wear levels (microns), the CMM does not detect small changes in surface texture, because the stylus used is too large. To the authors’ knowledge there are no validation studies in the literature for either system comparing the measured volumetric loss from a taper to the industry gold standard of gravimetric loss. One previous study used a virtual validation, based on a computational model of two common volume loss patterns, providing an error of 0.15% and 2.7% depending on the scale and the type of damage to the surface. One further study has undertaken a sensitivity analysis for taper linear and areal wear.
To investigate the taper connections, a method capable of observing 3-dimensional changes on taper surfaces is required, from which volumetric assessments of loss can be determined. In addition, accurate assessment of the taper angle is required if deviation from a manufacturer’s specified angle is to be assessed. The RedLuxTM (RedLux Ltd, Southampton) optical CMM can provide a high resolution (20 nm), 3D map of the surface to output surface finish changes as well as wear depth. The methodology is similar to that used for bearing surface assessment reported previously [22].
This study will present a validation of the RedLux technique for the assessment of volumetric values of material loss as well as taper angle assessment. In addition the study will investigate the sensitivity and repeatability of the technique in relation to data collection levels.
The validation study group consisted of 5 new cobalt chrome (CoCrMo) large diameter femoral heads. The heads were from the same manufacturer and all measured 42 mm with a +0 offset and manufactured to have 12/14 tapers.
The sensitivity and the repeatability study were both performed on a retrieved head with 42 mm diameter and +3.5 offset. The repeatability study only was performed on a second retrieved head with 50 mm diameter and 0.0 mm offset. Permission for the collection and analysis of the retrieved heads was granted by the National Research Ethics Service Committee South Central – Southampton A.
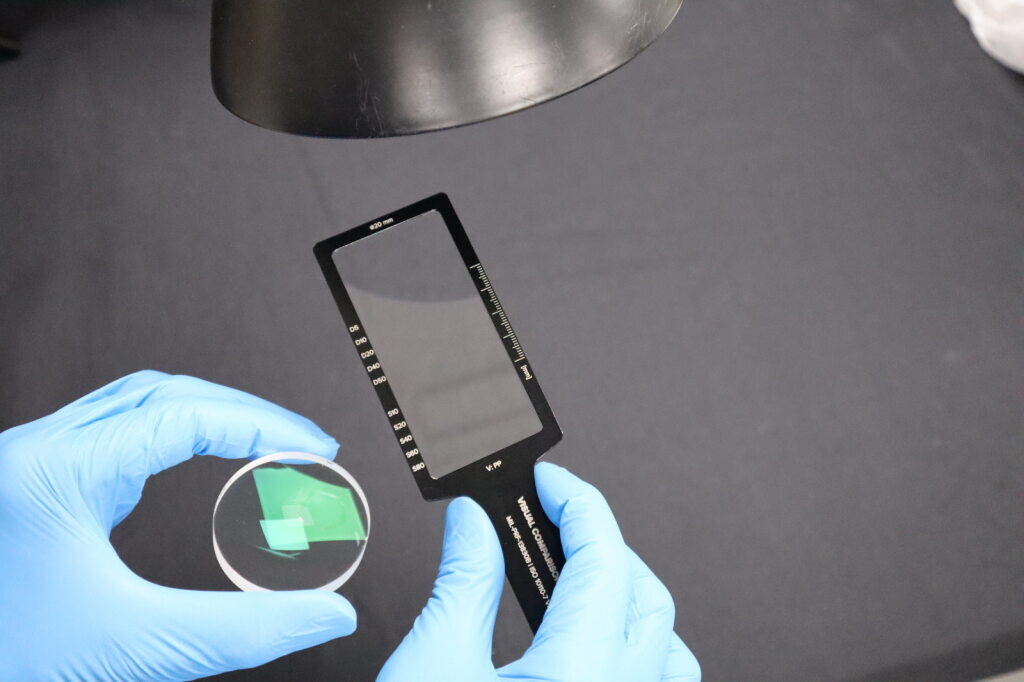
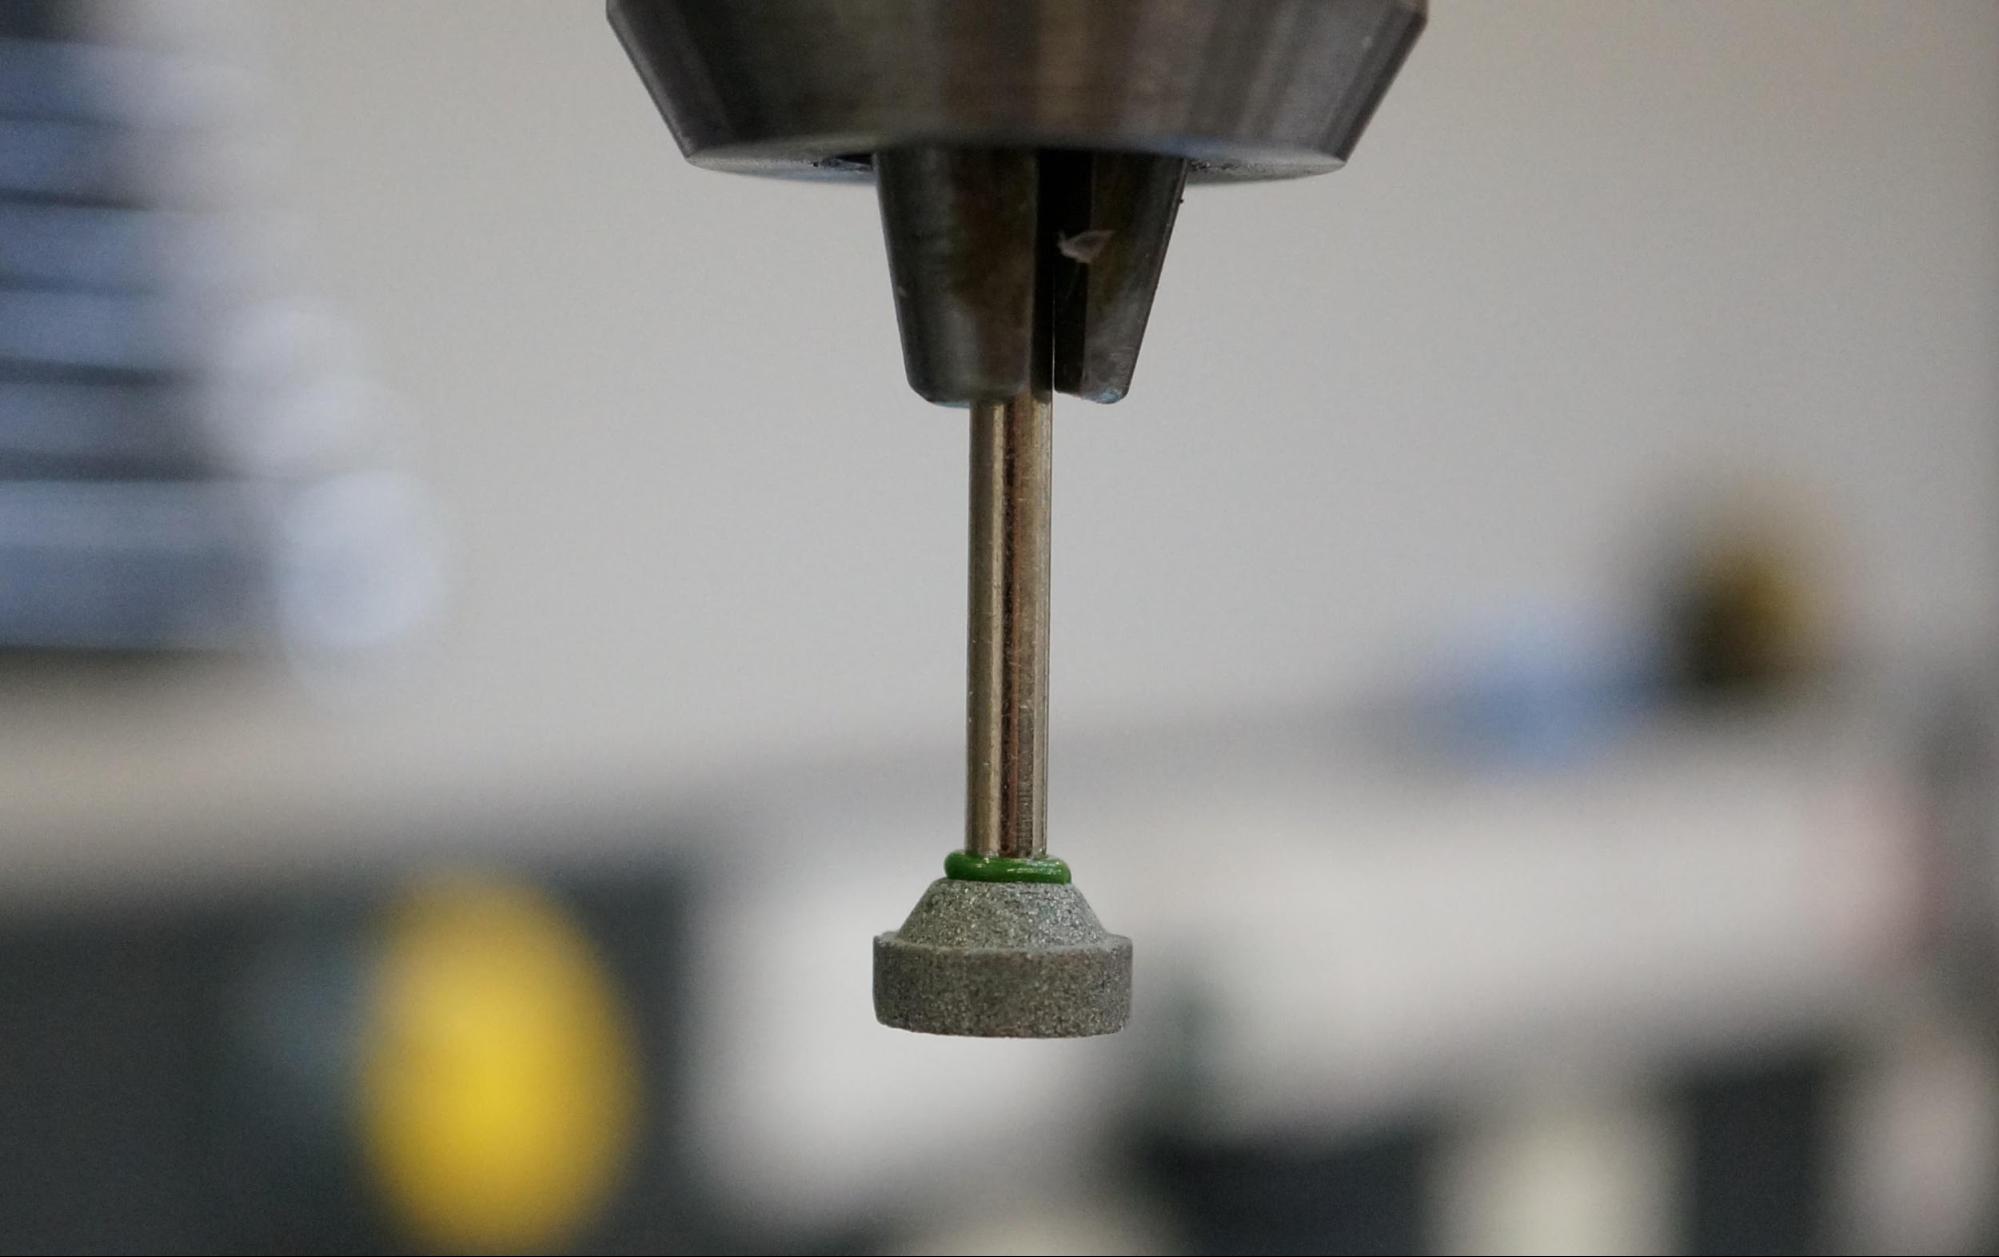
The taper surfaces were damaged using a silicon carbide (SiC) burr as shown in Figure 1. Three patterns were made in the taper surfaces to mimic the damage seen on retrieved taper interfaces. The first pattern is a ring of damage to simulate the ring of corrosion seen in many joints at one of the ends of the taper interface. The second pattern shows regions of damage at opposite sides and ends of the engagement zone indicative of the toggling process, the last was a diffuse region of damage extending over a wider area of the taper surface. The toggle damage heads were damaged twice to increase the amount of wear. The wear patterns are illustrated in Figure 3.
The baseline and damaged weights for gravimetric assessment were measured using a Genius ME235S Balance (Sartorius AG, Goettingen, Germany). For heads of mass ~150 g, the standard deviation (SD) for repeatability of the balance is ±0.025 mg (so, for instance, the ±2SD range of repeatability is 0.1 mg). The components were assessed five times pre- and post- damage. The average gravimetric measurement variation for each batch of five assessments was 0.11 mg (0.06-0.14 mg) – close to the theoretical ±2SD range. The volume loss was determined by assuming a specific density of 8.3 mg/mm3 for the CoCrMo alloy.
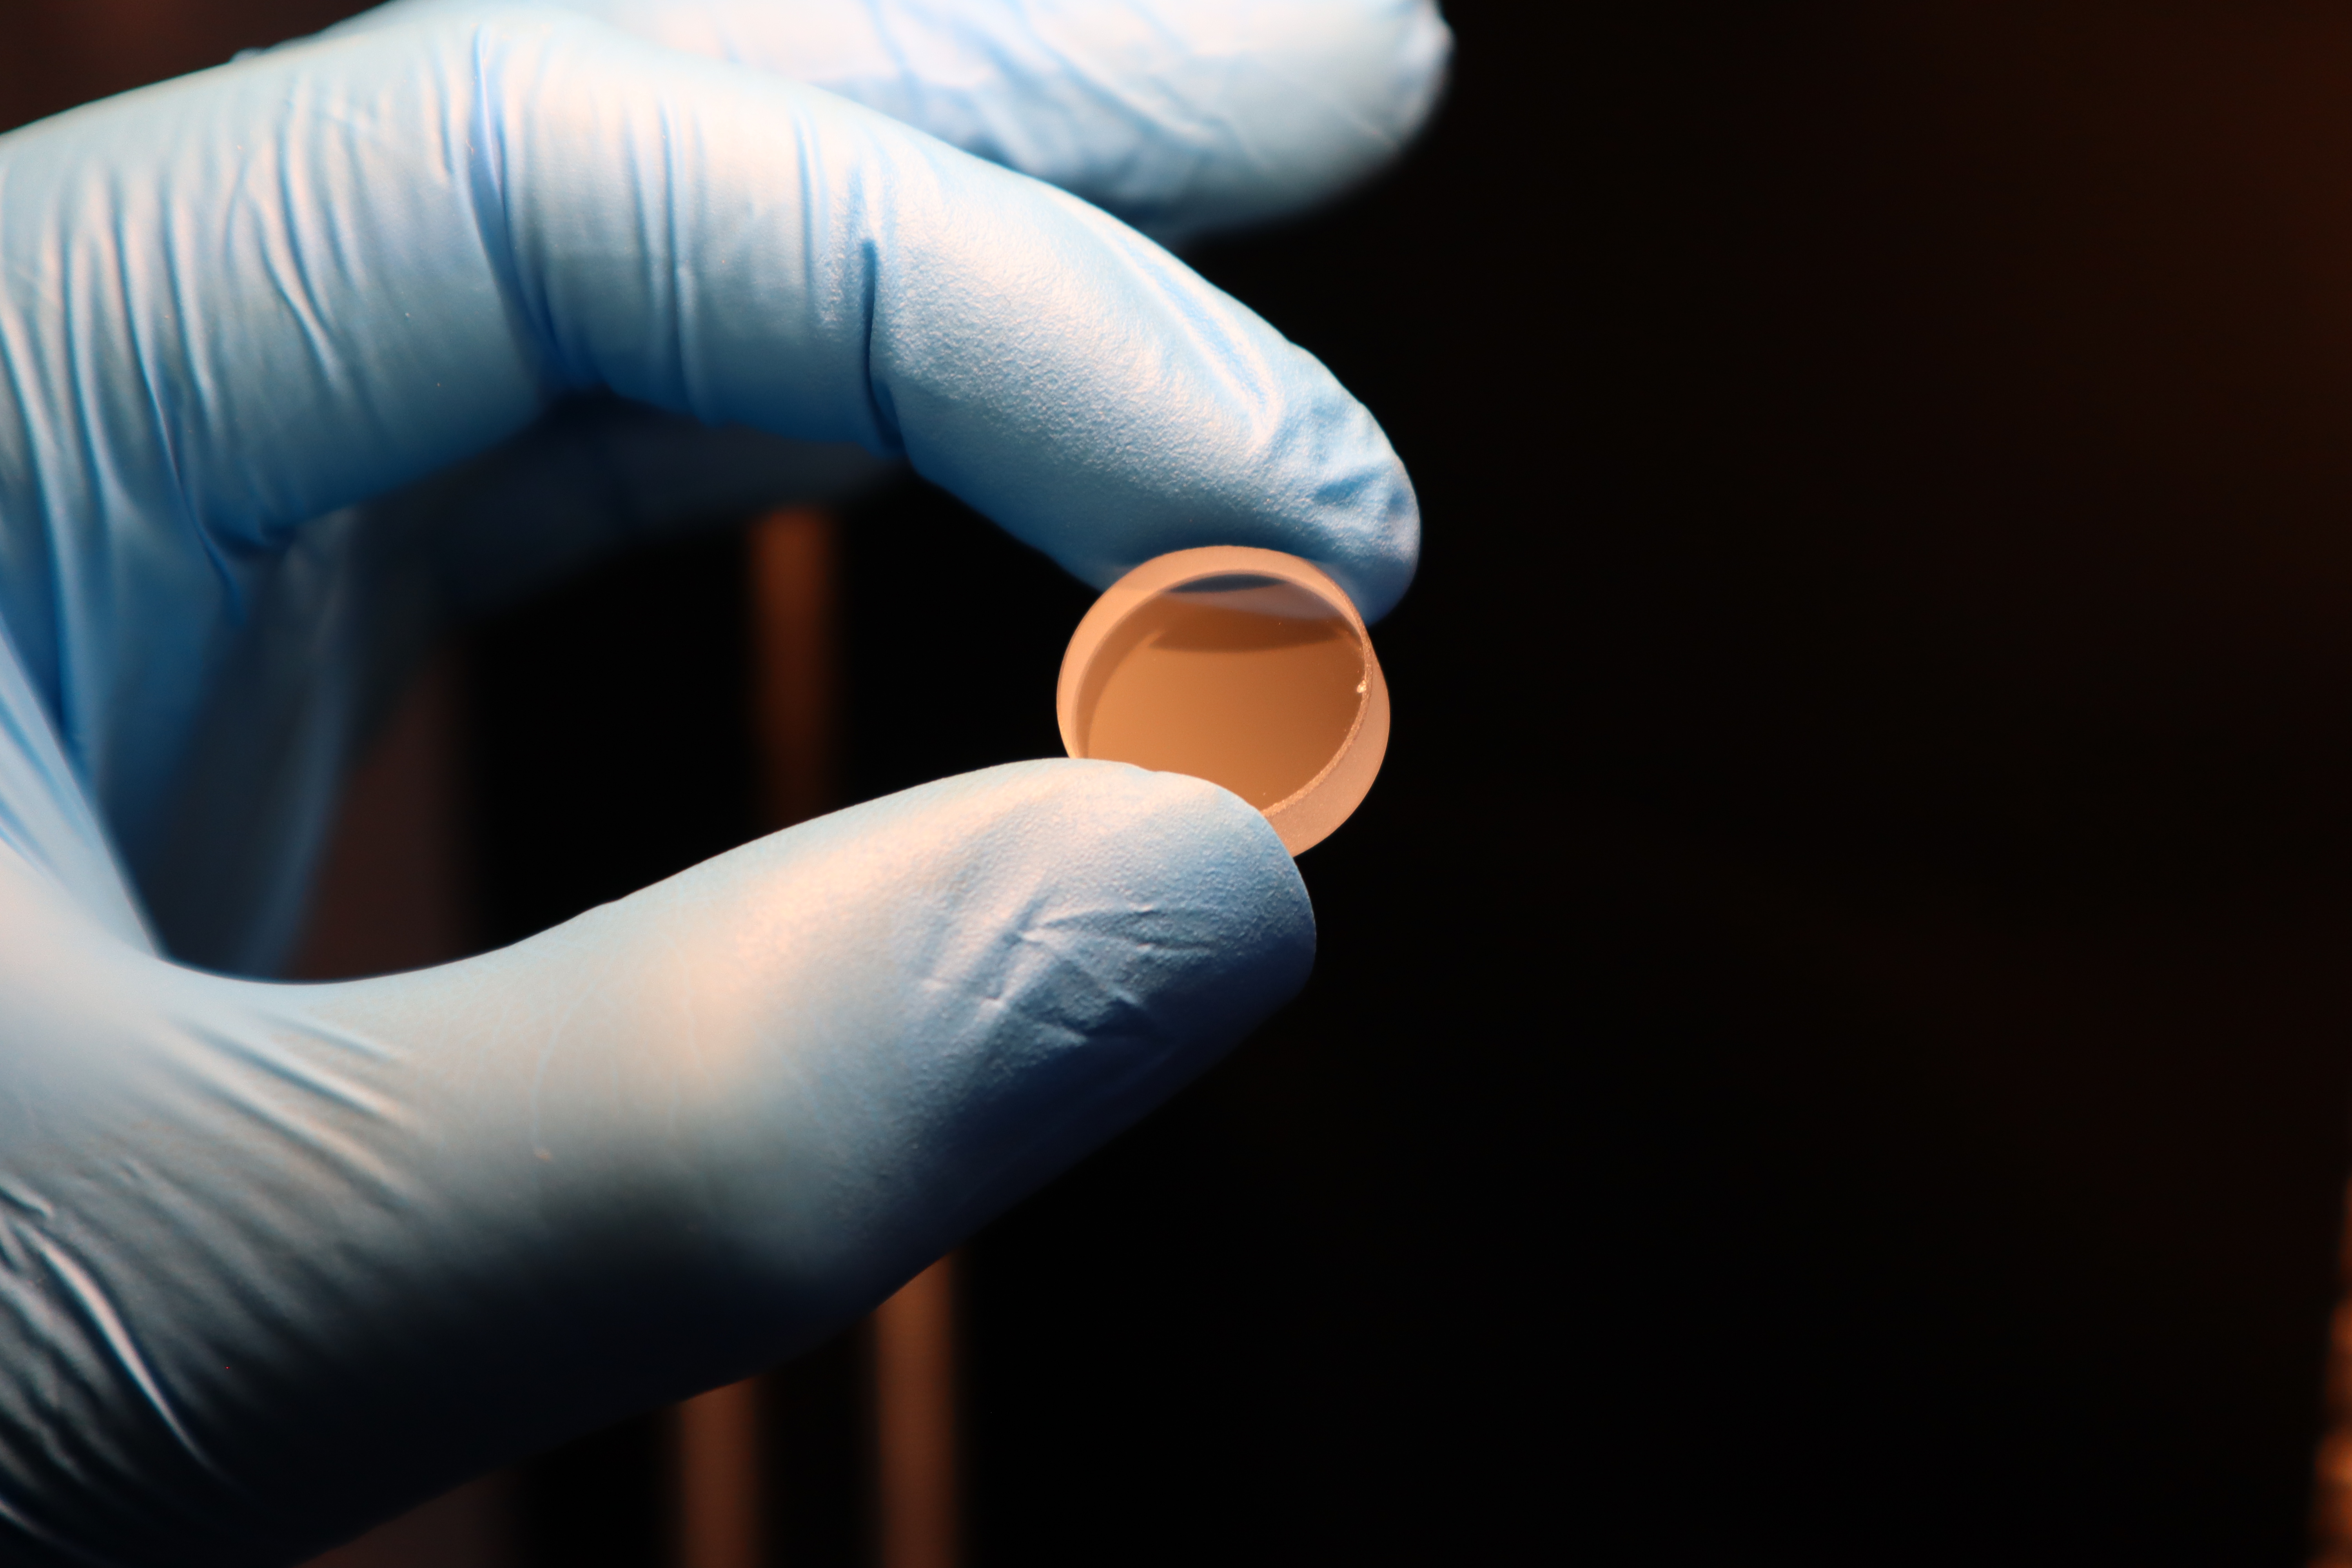
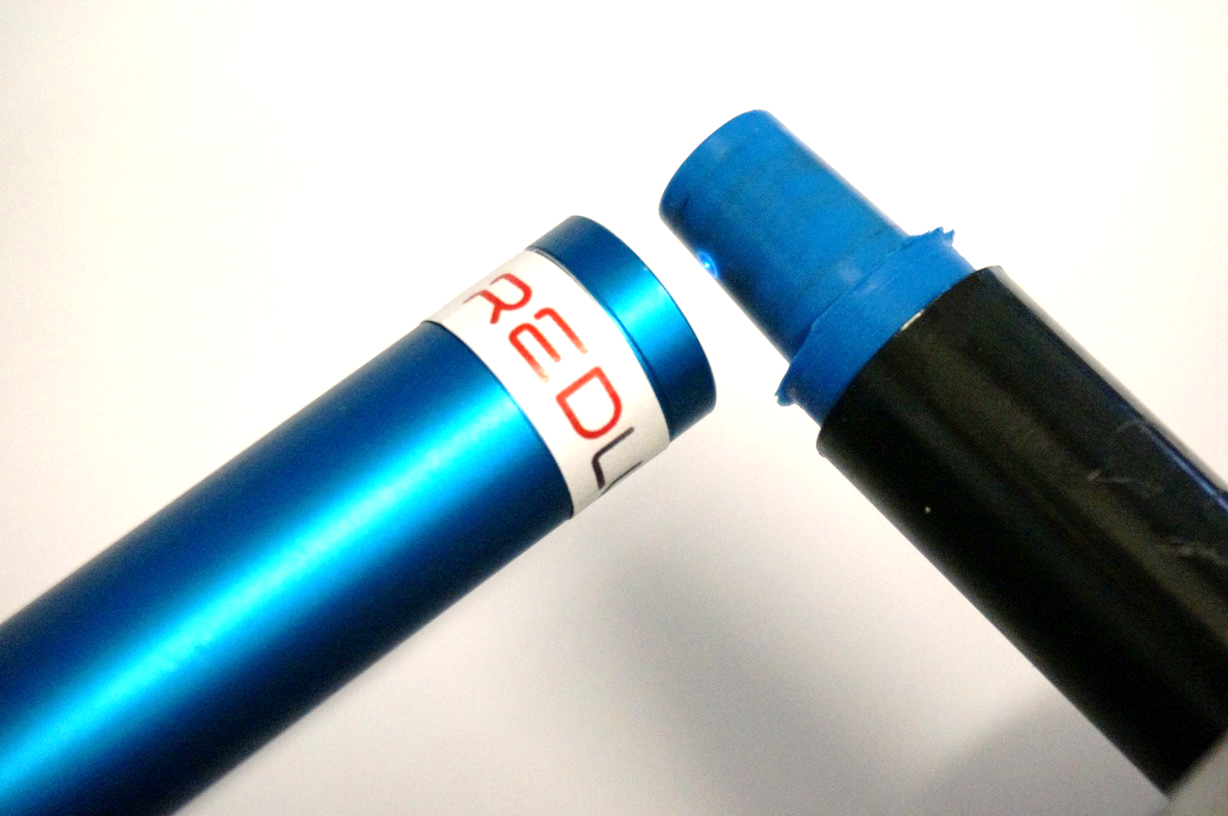
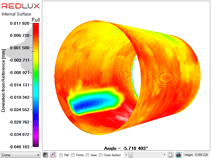
The measuring instrument has been described in detail in Tuke et al. (2010)[22]. To access the internal taper of the head, an imprint was taken by positioning a plastic tube (black tube in Figure 2) centrally over the female head taper, such that the tube axis was aligned with the taper axis. For later measurement, the tube is held directly in the machine chuck.
Microset 202 replication material (Microset Products Ltd, Hinckley, UK) was employed due to its high resolution of 0.05 μm (manufacturer’s specification) for the reproduction of surface texture. Figure 2 shows the imprint (blue) being measured by the optical sensor head. The white light spot has a diameter of 4 μm and the sensor can resolve distances to 20 nm.
The full lengths of the validation study taper imprints were assessed covering the intact regions at either end as well as the damaged region. For each measurement, 844,000 data points were acquired in a helical scan starting at the proximal end of the taper. For each revolution, 720 data points (two points per degree) were taken with 70 revolutions per mm axially. The chosen scanning strategy is the fastest way to measure these tapers, as it eliminates unnecessary starting and stopping of the motion system during data acquisition.
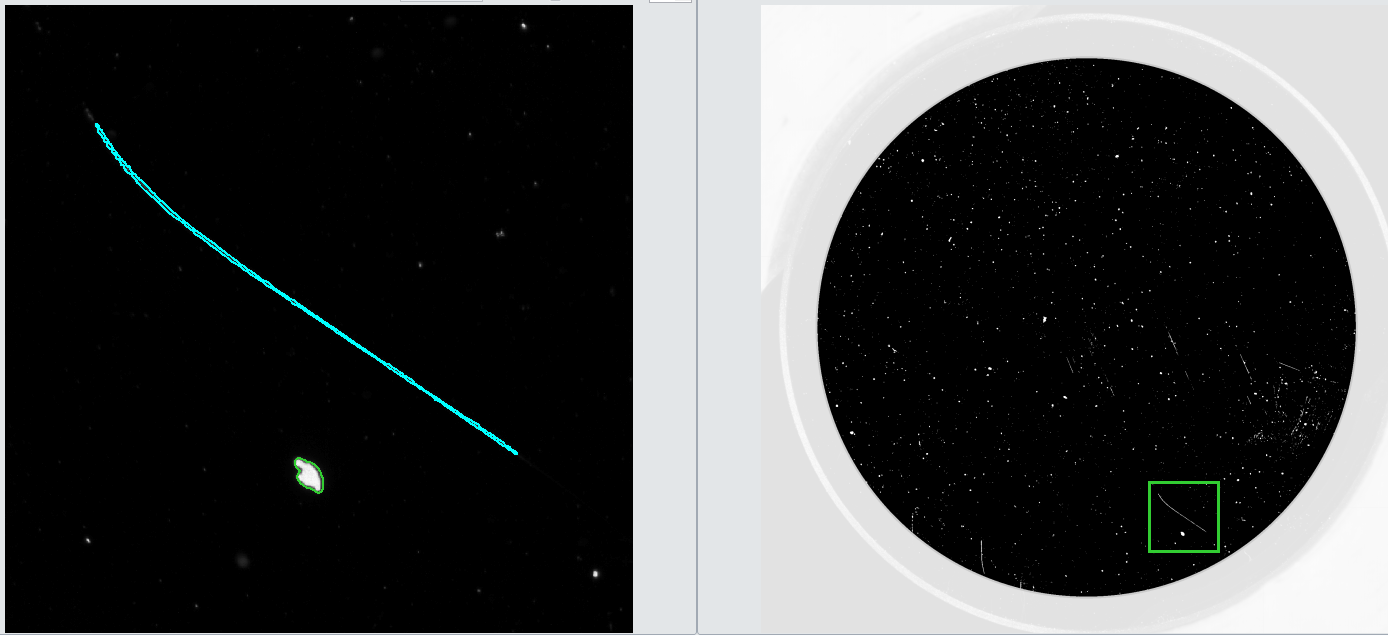
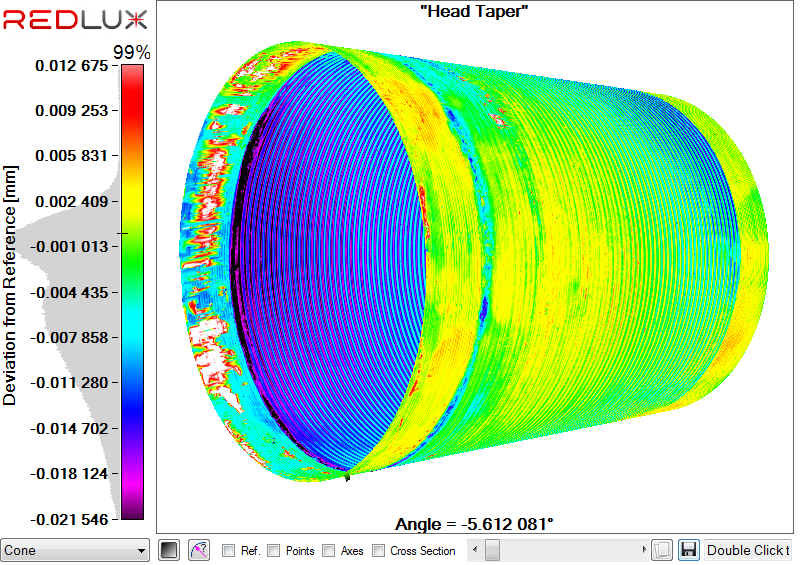
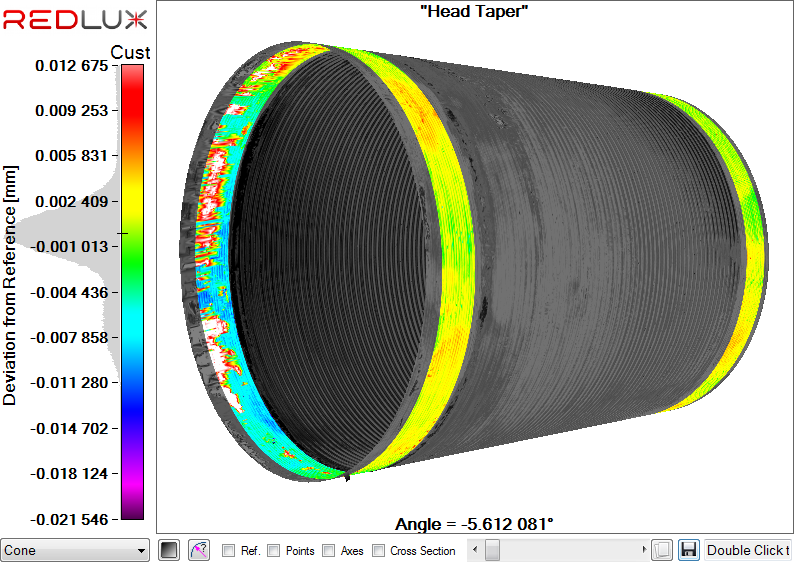
The resulting data set is then processed as demonstrated in Figure 3. From the initial data set (a), the regions of obvious material loss (b) and deposits (c) on the surface are removed, before fitting the best-fit cone (d) to the point cloud. Steps b, c and d might have to be repeated, if additional regions of material loss or deposits are identified during the fitting process.
 |
 |
| a) Initial data set | b) Main regions of material loss removed |
 |
 |
| c) Deposits removed | d) Final fitted data set |
The height distribution of the original surface is noted at the point when all material loss and deposits have been excluded from the surface after fitting of the best-fit cone. This provides a threshold value for determining the volumetric material loss. Data points below that threshold and their deviation from the fitted cone are counted towards volume loss.
The distinction between original surface and regions of material loss or deposits is made easier by a higher data density. This is discussed in more detail in sections 2.5 and 3.3.
The sensitivity study was performed to determine the point cloud density required to obtain an accurate value both for the taper angle and the volumetric loss from the taper surface. It was performed on one of the damaged validation study heads and a retrieved large diameter femoral head.
The point cloud density was varied by modifying both the number of points per degree circumferentially and the number of points collected axially. Table 2 shows the number of data points with the axial spacing in points per mm, the circumferential spacing in points per degree on the vertical and horizontal axes respectively. It should be noted that each measurement was performed and not simply interpolated from a higher-resolution measurement, to evaluate the influence of the increased speed of measurement due to the lower number of data points.
|
Circumferential spacing (points/degree) |
|||
|
1 |
2 |
||
|
Axial Spacing (points/mm) |
10 |
59400 |
118800 |
|
20 |
118800 |
237600 |
|
|
30 |
178200 |
356400 |
|
|
40 |
237600 |
475200 |
|
|
50 |
297000 |
594000 |
|
|
60 |
356400 |
712800 |
|
|
70 |
415800 |
831600 |
|
|
80 |
475200 |
950400 |
|
In order to gain an understanding of how the replication material might affect the measurement results for angle, 3 repeat castings were taken of a calibrated internal taper (Cromwell Metrology, UK) with an angle of 5°44’04.0” (5.7344°). The casts of the taper were measured at 1 point per degree and 30 points per mm.
The repeatability of the casting process was assessed using two retrieved large diameter femoral heads (42 and 50 mm with a +3.5 and 0 offset respectively). 3 repeat castings were made of the taper and assessed using a data collection cloud of 70 points per mm axially and 2 points per degree circumferentially.
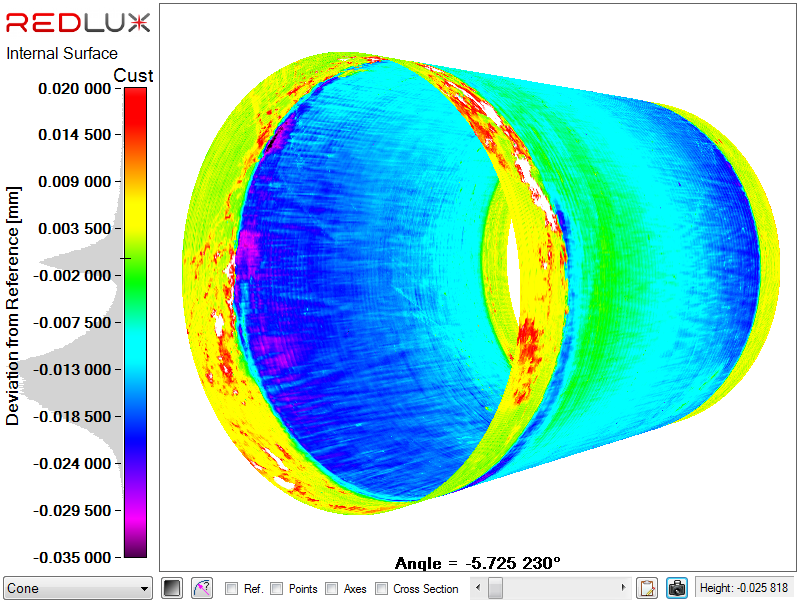
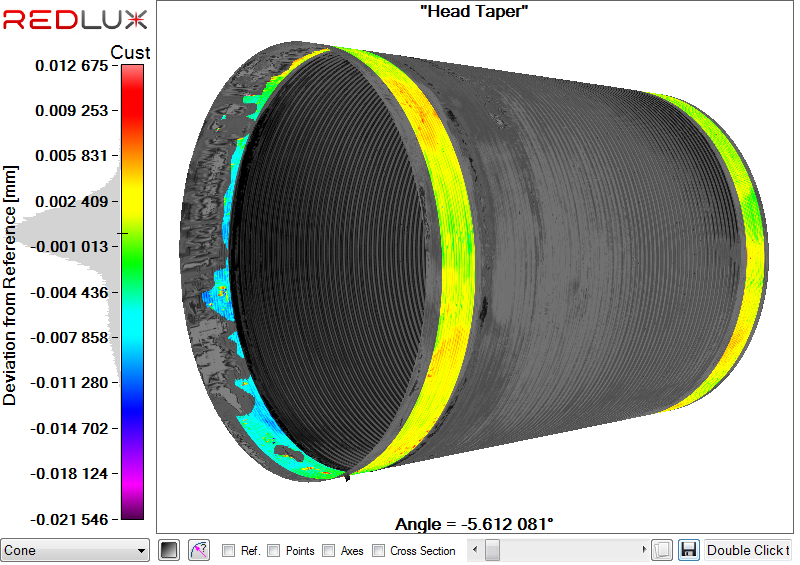
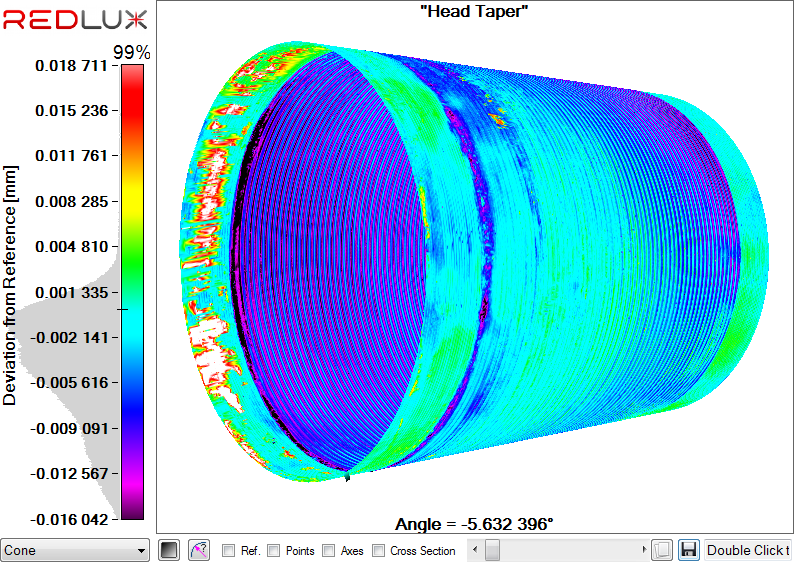
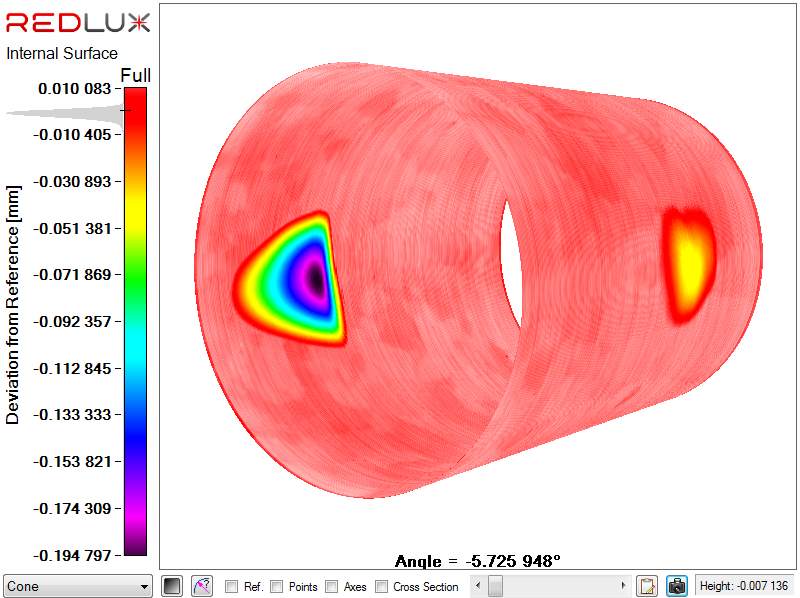
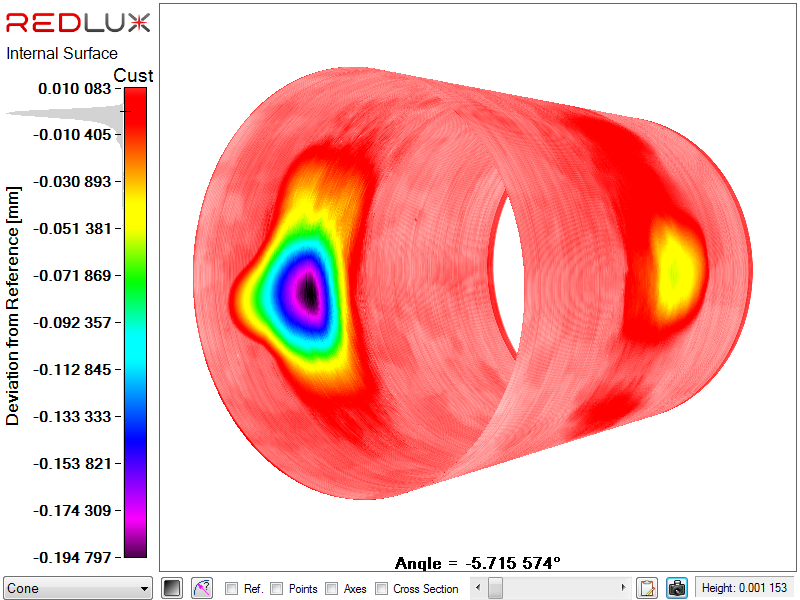
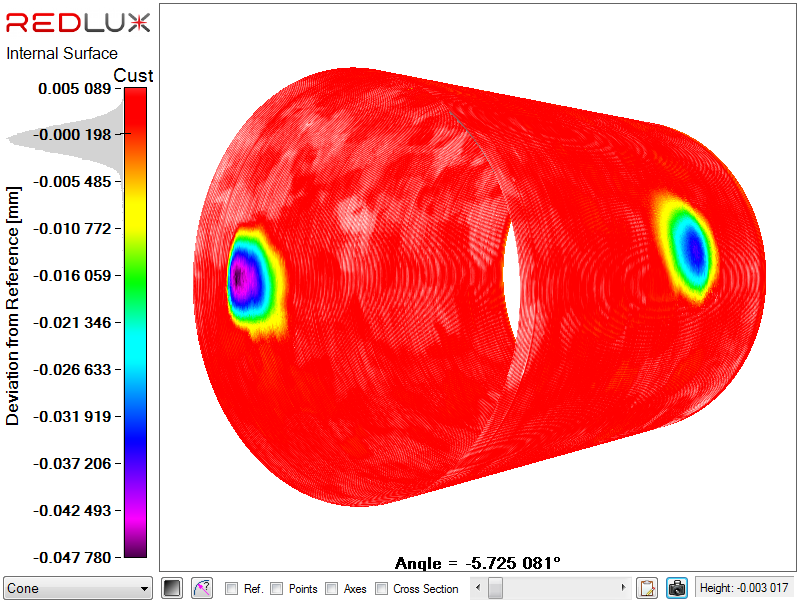
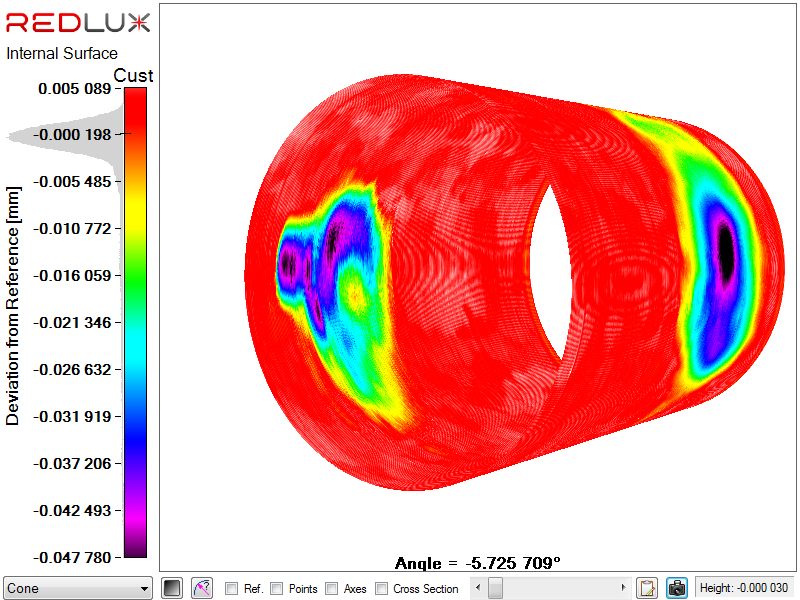
The damage patterns are shown in Figure 3. The colours represent the linear deviation from an ideal cone. Please note that the colour spectra on the graphs are on different scales. Low and high wear results are shown for components 3 and 4.
 |
 |
 |
|
Component 1 (ring) |
Component 2 (ring) |
Component 3 (toggle) |
 |
 |
 |
|
Component 3 (2) (toggle) |
Component 4 (toggle) |
Component 4 (2) (toggle) |
 |
||
|
Component 5 (stripe) |
||
Table 3 and Figure 5 compare the volume loss measured gravimetrically with the volume loss measured with the RedLux optical CMM. The average difference between the values was 0.065 mm3 (0.01-0.14). The relationship between the two measures is extremely high with a gradient of 1.012 and an R2 = 0.999 (Figure 4).
|
Taper No |
Gravimetric Loss (mm3) |
RedLux Loss (mm3) |
Difference (mm3) |
| 1 | 1.72 | 1.73 | 0.01 |
| 2 | 2.58 | 2.61 | 0.03 |
| 3 | 2.22 | 2.32 | 0.10 |
| 4 | 0.46 | 0.47 | 0.01 |
| 5 | 0.72 | 0.86 | 0.14 |
| 3 (2) | 4.67 | 4.80 | 0.13 |
| 4 (2) | 2.78 | 2.82 | 0.04 |
| Average | 0.065 mm3 |
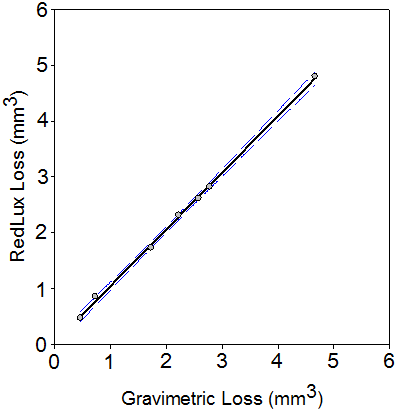 Figure 5: Regression plot of gravimetric volume loss vs. RedLux volume loss.
Bland-Altman analysis was undertaken to provide a comparative evaluation of the agreement between the gravimetrically and geometrically derived material loss. The analysis shows that the bias is 0.0657 mm3 (a slight over-estimation by the RedLux method) with limits of agreement (95%) of -0.0416 mm3 and 0.173 mm3.
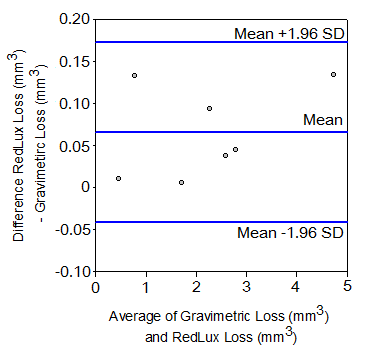 Figure 6: Bland-Altman plot comparing the Gravimetric volume loss vs. RedLux volume loss. Bias = 0.0657 mm3, Std Dev = 0.0547 mm3, Limits of Agreement (95%)= -0.0416 mm3, 0.1730 mm3
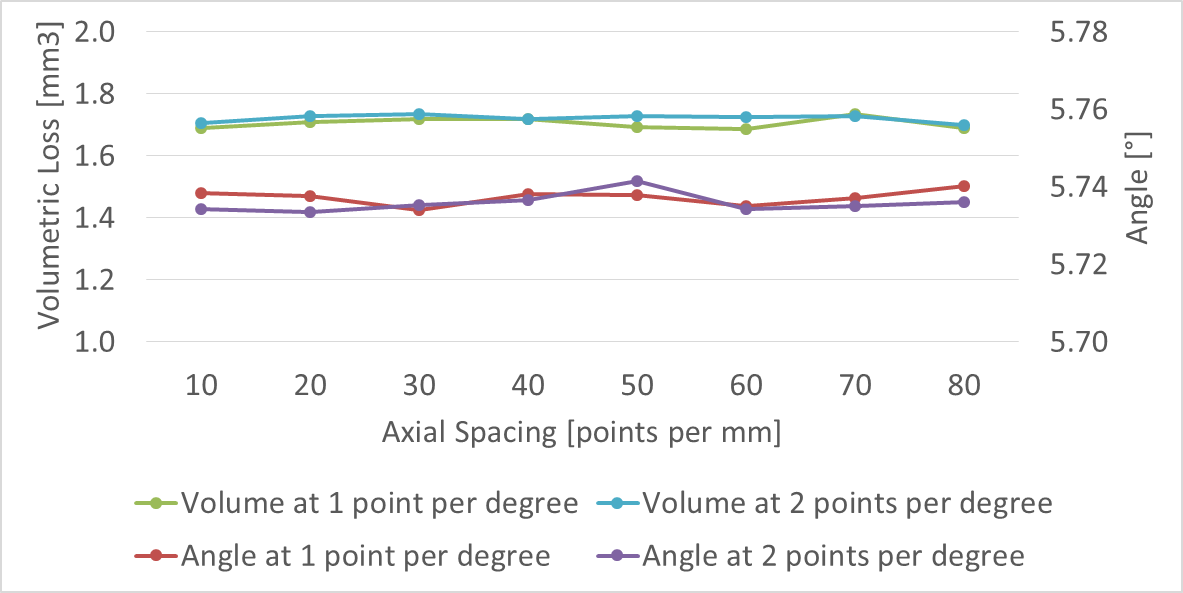
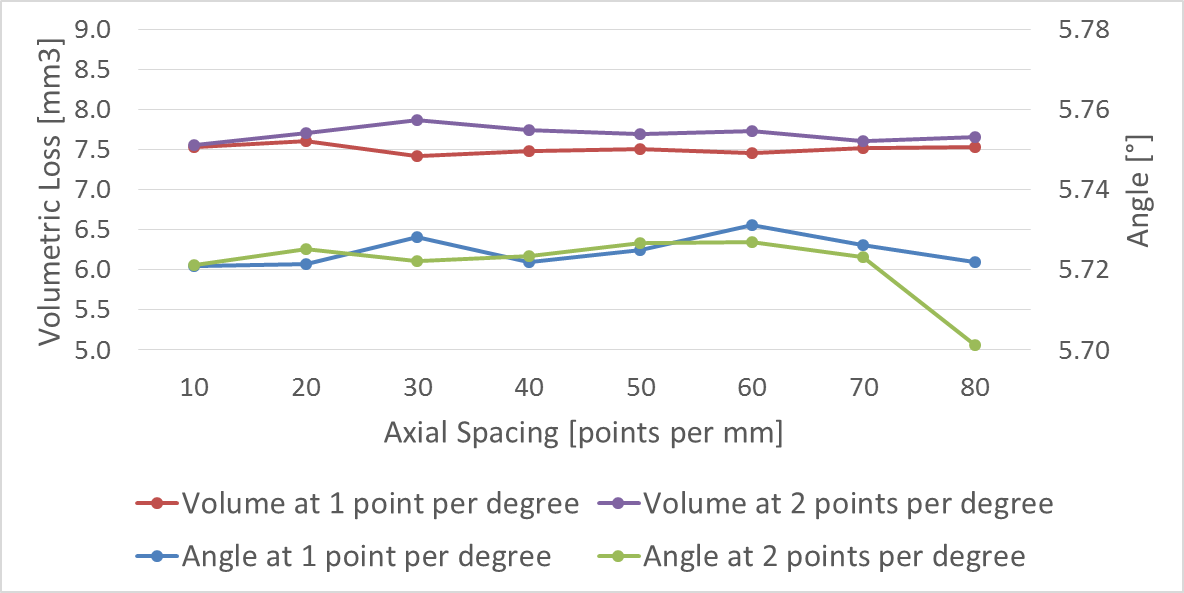
The results of the sensitivity study are listed in Table 4, Figure 6, Table 5 and Figure 7. The data spacing is shown as points per mm [pts/mm] along the taper axis and points per degree [pts/°] in circumferential direction. For comparison, the gravimetrically measured value for this component is 1.72 mm3.
|
Data spacing |
Angle |
Volume |
Data spacing |
Angle |
Volume |
||
|
[pts/mm] |
[pts/°] |
[°] |
[mm3] |
[pts/mm] |
[pts/°] |
[°] |
[mm3] |
|
10 |
1 |
5.738 |
1.69 |
10 |
2 |
5.734 |
1.71 |
|
20 |
1 |
5.738 |
1.71 |
20 |
2 |
5.734 |
1.73 |
|
30 |
1 |
5.734 |
1.72 |
30 |
2 |
5.735 |
1.74 |
|
40 |
1 |
5.738 |
1.72 |
40 |
2 |
5.737 |
1.72 |
|
50 |
1 |
5.738 |
1.69 |
50 |
2 |
5.742 |
1.73 |
|
60 |
1 |
5.735 |
1.69 |
60 |
2 |
5.734 |
1.72 |
|
70 |
1 |
5.737 |
1.73 |
70 |
2 |
5.735 |
1.73 |
|
80 |
1 |
5.740 |
1.69 |
80 |
2 |
5.736 |
1.70 |
|
Maximum Variation |
+/-0.003 |
+/-0.02 |
+/-0.004 |
+/-0.02 |
|||
|
Data spacing |
Angle |
Volume |
Data spacing |
Angle |
Volume |
||
|
[pts/mm] |
[pts/°] |
[°] |
[mm3] |
[pts/mm] |
[pts/°] |
[°] |
[mm3] |
|
10 |
1 |
5.721 |
7.535 |
10 |
2 |
5.721 |
7.562 |
|
20 |
1 |
5.721 |
7.613 |
20 |
2 |
5.725 |
7.707 |
|
30 |
1 |
5.728 |
7.424 |
30 |
2 |
5.722 |
7.874 |
|
40 |
1 |
5.722 |
7.479 |
40 |
2 |
5.723 |
7.749 |
|
50 |
1 |
5.725 |
7.505 |
50 |
2 |
5.727 |
7.702 |
|
60 |
1 |
5.731 |
7.456 |
60 |
2 |
5.727 |
7.729 |
|
70 |
1 |
5.726 |
7.52 |
70 |
2 |
5.723 |
7.606 |
|
80 |
1 |
5.722 |
7.531 |
80- |
2 |
5.701 |
7.657 |
|
Maximum Variation |
+/-0.005 |
+/-0.095 |
+/-0.015 |
+/-0.155 |
|||
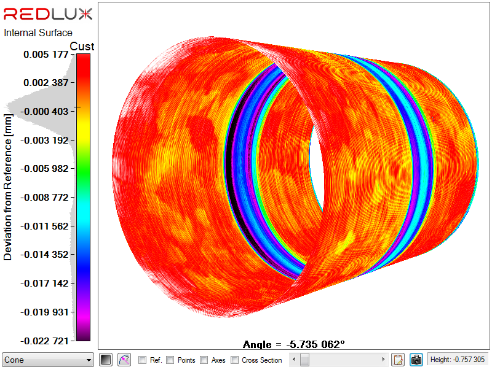
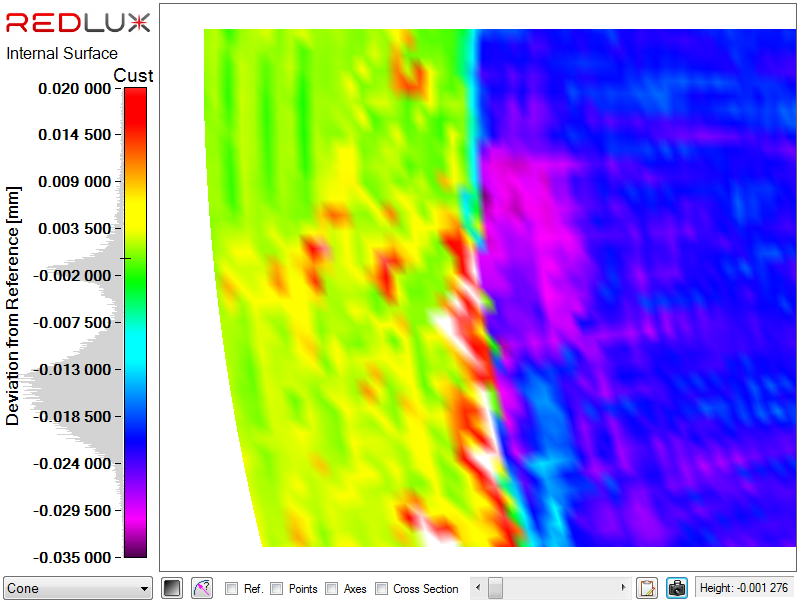 |
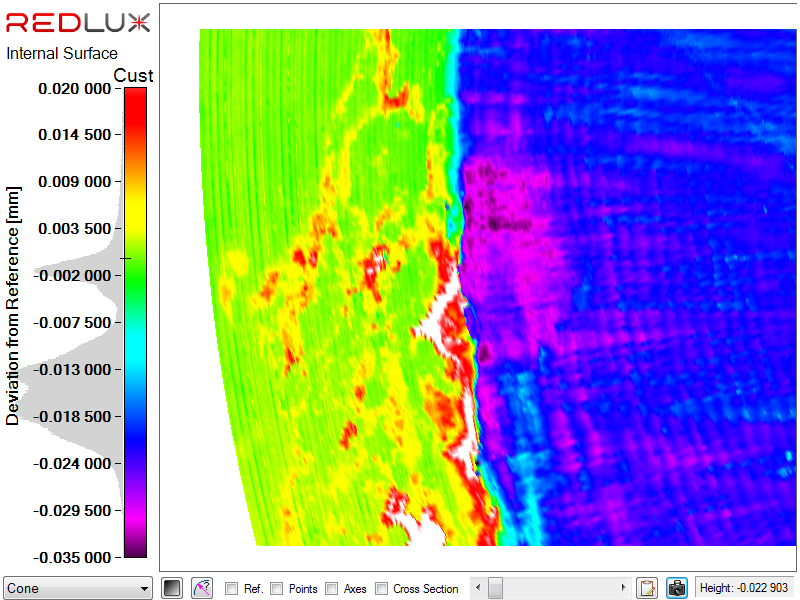 |
|
Retrieval measured at 10-1 |
Retrieval measured at 80-2 |
The form of the casts was assessed against a calibrated artefact for angle. Table 6 demonstrates the average taper angle to be within 0.0024°. The maximum deviation from the calibration artefact was +/-0.0085°.
|
Calibrated Angle(°) |
|
|
Calibration Artefact |
5.7344 |
|
Repeat Cast 1 |
5.7429 |
|
Repeat Cast 2 |
5.7357 |
|
Repeat Cast 3 |
5.7317 |
|
Average of Casts |
5.7368 |
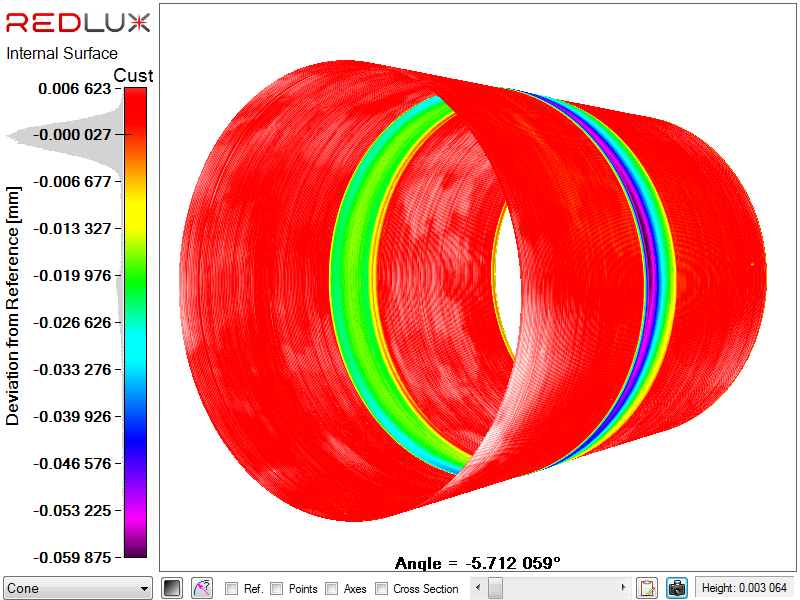
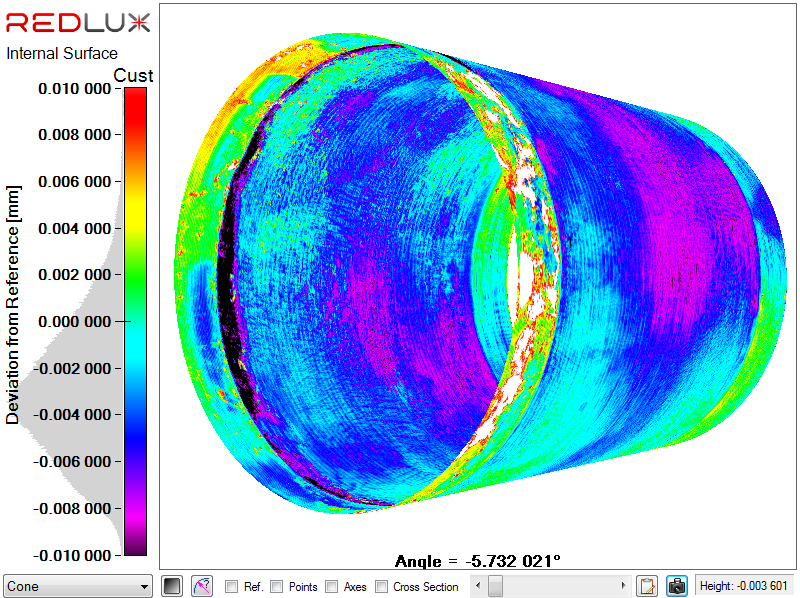
The repeatability of the casting process was assessed for two retrievals and the results are shown in Table 7 and Figure 9. For information, the maximum linear depth of retrieval 1 is 20 µm, while that of retrieval 2 is 41 µm.
|
Retrieval 1 (50 mm) |
Retrieval 2 (42 mm) |
|||
|
Repeat |
Angle (°) |
Volume (mm3) |
Angle (°) |
Volume (mm3) |
|
1 |
5.732 |
0.55 |
5.725 |
7.47 |
|
2 |
5.736 |
0.85 |
5.730 |
7.15 |
|
3 |
5.743 |
0.57 |
5.736 |
7.26 |
|
Maximum Variation |
+/-0.0055 |
+/-0.15 |
+/-0.0055 |
+/-0.16 |
 |
 |
| Retrieval 1 (50 mm) | Retrieval 2 (42 mm) |
Volumetric material loss for taper junctions have been reported by a number of authors for many years. To our knowledge, no substantial validation of these measurements has been published to date in the peer-reviewed literature. The contribution of taper damage to the overall material loss from the implant hinges on a correct, validated measurement of material loss in the taper.
Linear wear has not been considered in this study, as it is a poor indicator of volumetric loss. Retrieved tapers can have small, deep pits, but very little volumetric loss, as demonstrated by the retrievals presented in section 3.5, which showed a factor of 2 for linear depth as opposed to a factor of 11 for volumetric loss. This is in contrast to the bearing surface, where there is a more defined wear scar and a correlation between linear and volumetric wear.
The artificially-simulated damage profiles for the ring-shaped wear scar of components 1 and 2 and the wear toggle patterns in components 3 and 4 are a good approximation of wear scar patterns found in retrievals. The larger pattern in component 5 is less representative of in-vivo observed wear effects, but still serves in evaluating the measurement methodology. The volume losses in all cases are in line with volumes reported from retrieval cohorts [16, 20, 21].
The results from the RedLux optical CMM are very slightly larger than the gravimetric data results. This is reflected in the Bland-Altman bias value of 0.0657. It is difficult to determine the exact source of these differences, as the magnitudes involved are small. However, possible sources of deviation are outlined here.
Although gravimetric assessment is considered the ‘gold standard’, it is in practice still subject to uncertainty. The gravimetric measurement of the part is limited in accuracy and repeatability by two factors: the measurement protocol, and the balance performance. Protocol is more challenging when measuring a concave profile, since internal recesses are harder to clean effectively. The relative magnitude of weight changes is also very small; for a part weighing 150 g, the average weight loss in this study was just under 18 mg; i.e. 1 part in 8333.
The repeatability of the balance used in this study is quoted by the manufacturer as ±0.025 mg standard deviation; a ±3SD range would equate to 0.15 mg, or in volumetric terms approximately 0.02 mm³. These variations were confirmed by re-measurement of the parts in this study. Given that the smallest wear volume was only 0.46 mm³, these repeatability errors could be several percent, in relative terms.
A standard literature-value was assumed for CoCrMo density (8.3 mg/mm³) when converting from volumetric to gravimetric values. The exact density value varies for standard grades of CoCrMo (e.g. ASTM F1537, F75, F799). This may account for some bias in the conversion process, although is unlikely to be greater than 1%.
There are limitations to volumetric measurement, whether using legacy contact-based CMMs or advanced optical variations. Very fine-resolution features may not be accurately profiled, and sharp changes in profile form may be smoothed over. However, the results of the sensitivity study (discussed below) would suggest that these effects are in the order of just a few percent and not significantly affecting the results reported here.
When estimating wear via volumetric methods, certain assumptions must be made. It is necessary to assume that the original intact surface can be reconstructed from a partial representative region; in practice this assumption will always induce small levels of error. A common numerical practice is to threshold the resulting surface deviations, to avoid including standard manufacturing variations in the wear estimate. However, the precise level at which this thresholding is applied is in itself a further internal numerical variable which can affect accuracy.
The morphology of the wear scar is likely to be a significant determinant of accuracy in some cases. In particular, if material loss extends over large regions or over the entire component, such that little or no ‘intact’ surface can be used to fit a reference surface to, it is difficult to reconstruct the original, as-machined surface (due to implant design or high wear). The type 2 pattern of material loss is such a situation, where an accurate assessment is difficult.[23]
With all point-based surface-measurement methods, a trade-off exists between the time taken to perform measurements, and the resolution of the measurement, in terms of spacing between point samples. The concern is that low sample levels will adversely affect the resulting measurement accuracy. Encouragingly, the sensitivity study performed here indicates that in fact for the resolution combinations used here, this is not the case. Maximum taper angle variations were under 0.008° in all cases (less than ½ of an arc-minute). Reported volumes varied between 1.69 and 1.74 mm³, equivalent to less than 3%. The fact that convergence is not observed within this sensitivity dataset implies that other factors (e.g. selection of intact regions, cone-profile fitting and thresholding) are having more influence than the sampling regime.
Differentiation of the original surface from the damaged regions is easier in high-wear samples, as there is less ambiguity and overlap between manufactured form defects and tribological artefacts. Care must be taken when judging low-wear cases.
Considering measured volumes alone, the sensitivity study suggests that the measured volume is independent of the number of data points within the investigated boundaries. A lower number of data points is preferable as it allows a measurement of a taper within just a few minutes. However, a higher number of data points make the distinction between original, as-manufactured surface and damaged regions easier. A higher number of data points also provide valuable information on the full surface profile, which can assist in the determination of the mechanisms involved in material loss.
The retrieval analysis demonstrated a maximum variation for the measured taper angle of 0.011° (less than 1 arc-minute). The volumetric wear had a maximum variation of 0.32 mm³.
It is important to recognise that the optical assessment method described in this study is a three-stage process; first, the imprint must be formed, then the measurement made using this imprint and finally the point cloud must be analysed. As such, errors at any stage are cumulative in the total reported variation.
The repeatability results for the retrieved components are worse than for those that have undergone controlled wear, due to the complexity of determining the original surface in the presence of various deposits and potential damage outside the contact region between head and stem.
This study demonstrates that the RedLux system is an accurate and repeatable method for the assessment of material loss from tapers. The limits of agreement (95%) between the optical CMM and the gravimetric values for material loss are -0.0416 mm3 and 0.173 mm3. The average measured angle was assessed against a calibrated taper and shown to be within 0.0024°.
The sensitivity analysis demonstrated that the measured volume is independent of levels of data tested within study. However, a higher number of data points can aid the separation of original taper surface from the damaged taper surface and allows for visualisation of the full surface profile, which can assist in the determination of the mechanisms involved in material loss. There is therefore the option to choose between a high measurement speed with measurements taking just a few minutes and a higher resolution, where measurements may take tens of minutes.
The authors wish to thank MatOrtho for the supply of the new components.