When specifying the quality of any optical surface, manufacturers and customers can select from a variety of available standards. Worldwide, MIL-PRF-13830B (MIL-O-13830) and ISO 10110-7 are the most widely adopted standards, while ANSI/OEOSC OP1.002 and MIL-C-48497A are notable but far less common.
Each of the standards carry some level of variation in the technical approach to controlling optical surface quality. Further to this, while each standard seeks to provide the necessary technical details, between them, they do not offer a common structure or gated process to follow for inspecting optical surfaces.
It is therefore common to see differences in interpretation and implementation of each of these standards within different parts of the supply chain that lead to variation and disagreement in results. Industry wide, this causes a problem which is known to have a significant impact on the cost of product and customer confidence.
It is now widely understood within the optics industry that achieving broad alignment on the interpretation of the available standards will help to improve the processes and costs associated with surface quality. Looking forward, broad agreement on the existing standards would also facilitate improved conversations and collaboration on development of those standards.
Contributing to this effort, we have developed a simple framework, that once applied, offers a foundation for clear understanding and comparison of each of the surface quality standards.
Our simple three-step framework
For each of the relevant standards, the process for controlling imperfections can be grouped into three logical and sequential steps:
1. Detection
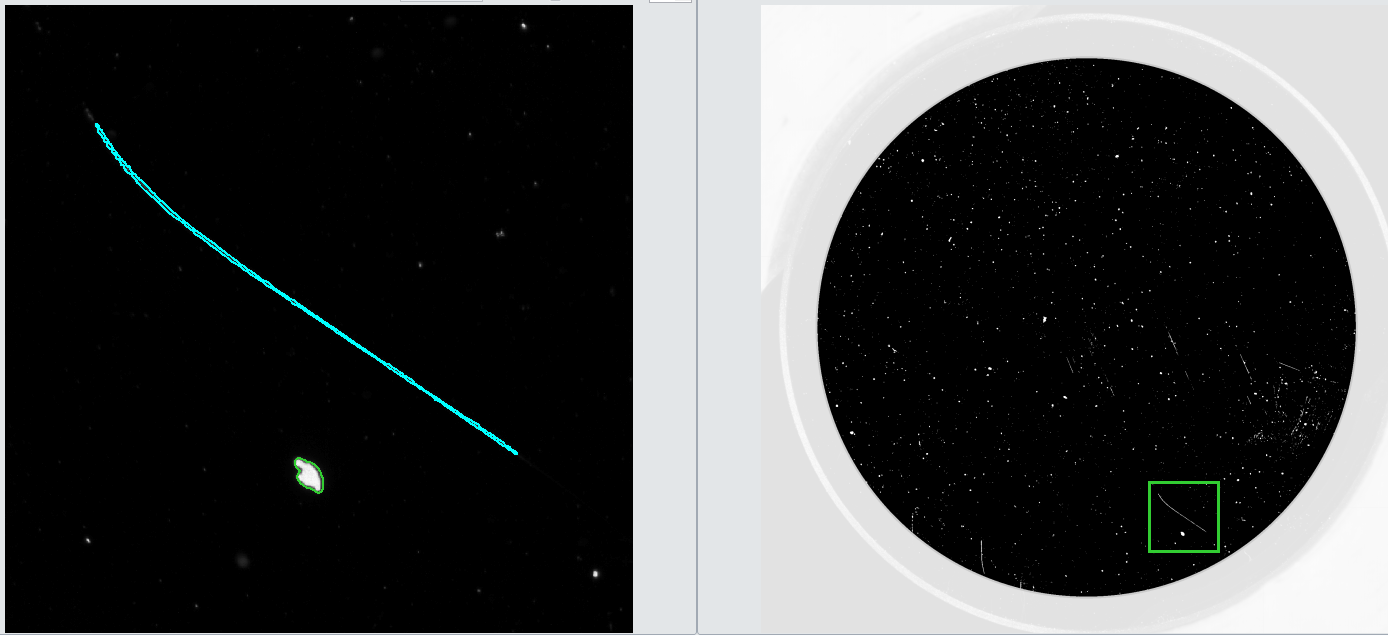
This first step includes a process for how imperfections should be detected or identified. It is therefore relevant to the overall sensitivity of the surface quality control process. Imperfections that are not detected at this stage of the process will not be considered in the final assessment, therefore, to achieve consistency and provide a solid basis for final evaluation it is crucial that this step is well controlled and reliable. When this step is carried out by the human eye results will be subjective, even when training and apparatus are well managed. Machine vision can be shown to provide a highly repeatable solution to this step.
Key Consideration: This first step determines the sensitivity of the overall process.
2. Characterisation
The second step includes methods for defining how surface imperfections should be characterised individually. It almost always involves assigning the ‘type’ of imperfection based on classification, and then applying a grading system to assign a ‘grade’. Depending on the standard being applied, this step can require the inspector to determine (measure) several relevant qualities including area (footprint), width, length, ‘apparent brightness’, ‘apparent diameter’, and location on the surface.
It is important that each of the measurements to be carried out in this step are accurate, repeatable, and reproducible. This is because any accumulation in error or variation at this stage will have a significant negative impact on the reliability of the overall inspection process. By utilising tested algorithms, with measurable performance, machine vision can provide a high level of accuracy, repeatability, and reproducibility that can significantly outperform the human eye in this task.
Key Consideration: The output of steps 1 and 2 is a complete list of all relevant imperfections. Each of these imperfections has been detected and characterised as prescribed by the relevant standard.
3. Evaluation
This final step involves evaluating the complete list of all relevant imperfections generated by steps 1 and 2 against a series of logical rules which set the tolerances. In some cases, there are as many as 9 separate rules to calculate and check. These rules typically include a maximum permissible grade (and quantity) for imperfections, which can be easy to understand and apply but can also include more complex tests, such as a tolerance for the combined lengths of imperfections.
Manually calculating, testing, and documenting each of these rules can be very time consuming, and therefore impractical, when more than a few imperfections are found. Machine vision solutions can automate this step entirely, reducing cycle time whilst removing the potential for human error.
Key Consideration: The desired output of step 3 will generally be a pass/fail status with respect to a test specification.
In addition to the above steps, it is useful to consider that each standard will adopt one of two established approaches when working through steps 1 and 2:
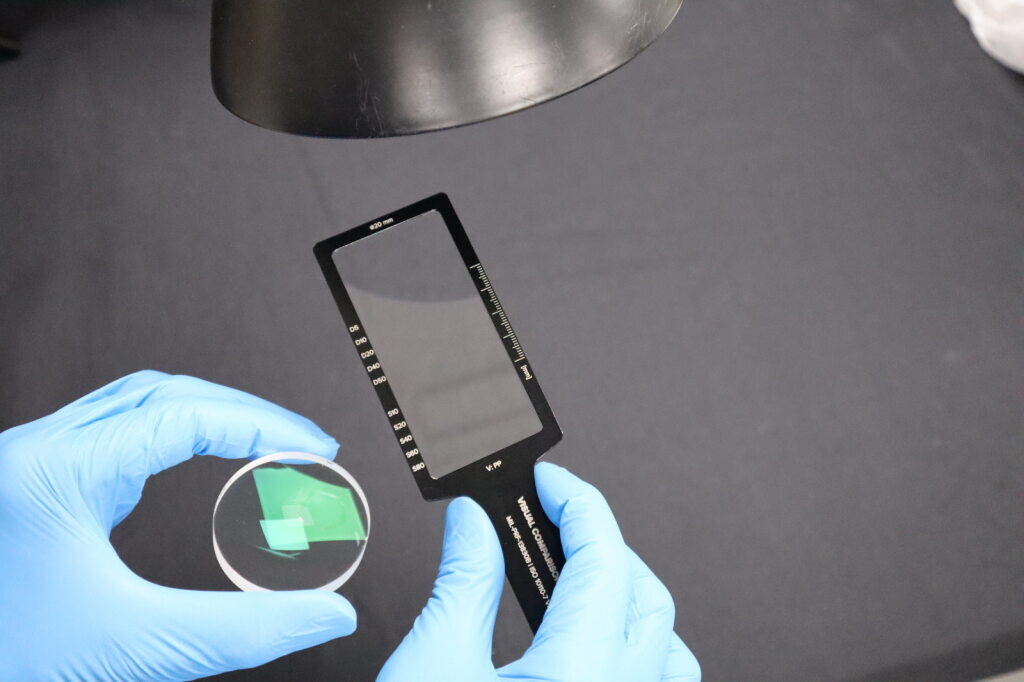
The visual approach – imperfections are detected and characterised cosmetically, by their ‘apparent brightness’ and ‘apparent size’ (both visual weightings).
The dimensional approach – imperfections are characterised dimensionally, by their area (surface footprint), diameter, or width and length.
While known to be subjective, it is still common to see use of the human eye for assessing optical surface quality in both approaches. Machine vision technology, however, provides a solution by removing subjectivity and creates a more accurate, repeatable, and reproducible inspection process.
Do you want to find out more?
We have utilised the above framework to support a detailed review of MIL-PRF-13830B and ISO 10110-7 in our Industry guide to optical surface quality standards white paper.